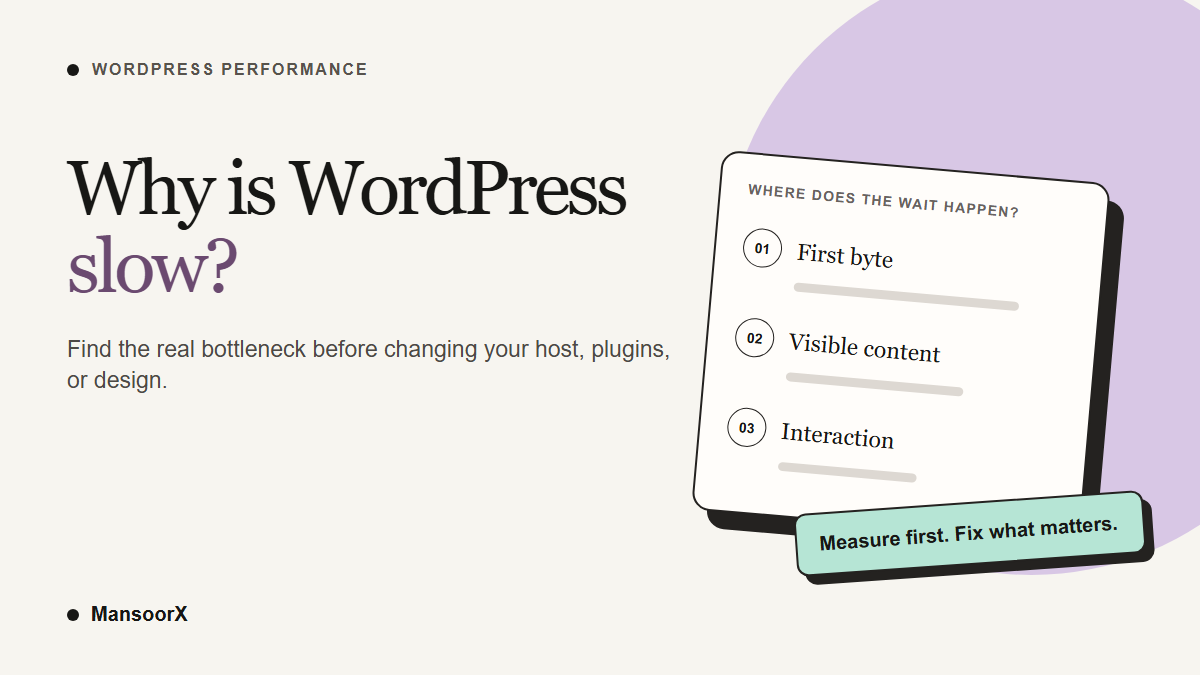
If your WordPress site feels slow, do not start by installing another speed plugin. First find out what is slow: the server response, the main content appearing, a click or tap, or the layout settling. Those problems have different fixes. A large image will not explain a slow database query, and a faster host will not remove a third-party script that blocks the browser.
Open PageSpeed Insights for the exact page that feels slow, on mobile and desktop. Look at the real-user data if Google has enough of it, then use the lab diagnostics to investigate. Test a logged-out visit too. The WordPress admin bar and uncached editor view are not what a new customer sees.
Start with the numbers that describe the problem
Google’s PageSpeed Insights documentation separates field data from lab data. Field data summarizes real Chrome users over a rolling 28-day period, if the URL or origin has enough samples. Lab data is a simulated visit that helps explain a specific load. A fresh page or low-traffic site may have no URL-level field data; do not treat that absence as a passing score.
| Measure | Good real-user threshold | Question it answers |
|---|---|---|
| Largest Contentful Paint (LCP) | 2.5 seconds or less | When did the largest visible content appear? |
| Interaction to Next Paint (INP) | 200 milliseconds or less | How quickly did the page respond to an interaction? |
| Cumulative Layout Shift (CLS) | 0.1 or less | Did visible content move unexpectedly? |
Those thresholds apply to the 75th percentile of visits, not one good run on your laptop. LCP, INP, and CLS are the Core Web Vitals. Time to first byte (TTFB) is also useful: it measures how long the browser waits for the first byte of the page response. Google describes 0.8 seconds or less as a rough good target for most sites, but TTFB is not itself a Core Web Vital. A slow TTFB can delay everything that follows; a good TTFB does not prove the page paints quickly.
Google says Core Web Vitals are used by its ranking systems, but good scores do not guarantee high rankings. I would use these numbers to make the site better for its visitors, not to chase a perfect Lighthouse score at the expense of a useful feature.
A small measurement, and what it cannot tell us
For this revision, five logged-out HTTP requests were sent to the public MansoorX homepage from one network location on 27 September 2026. The median time to first byte was 1.245 seconds; the five readings ranged from 1.185 to 1.784 seconds. The server sent 18,654 bytes of gzip-compressed HTML on each response. These are direct HTTP measurements, not a mobile Lighthouse run or real-user Core Web Vitals.
That result tells me to inspect the response path, but not to declare the host at fault. Network distance, connection setup, server work, and any cache between the visitor and WordPress all affect TTFB. It also says nothing about the hero image, fonts, scripts, or what happened after the HTML arrived. That is why I would compare the same URL from more than one location and inspect a browser waterfall before buying a new hosting plan.
If the first byte is late, inspect the server path
Start by comparing a public, logged-out page with a logged-in view and an uncached page. If the anonymous page is quick but the admin or checkout is slow, a page cache may be hiding expensive dynamic work. If the public page is slow too, ask your host for server-side timing, PHP worker saturation, slow-query logs, and cache status. The result might be a slow plugin query, an external API call, overloaded hosting, or a missing cache. It is not automatically “shared hosting.”
WordPress distinguishes page, browser, object, and server caching. A page cache can serve rendered content without running the full WordPress request for each anonymous visit. A persistent object cache can reduce repeated database work on requests that still need PHP. They solve different problems, and your host may already provide one or both. Check what exists before adding another plugin.
Do not apply full-page caching indiscriminately to a store or membership site. WooCommerce caching guidance says cart, checkout, and account pages should remain dynamic because they contain customer-specific information. If those pages are slow, investigate the uncached server work rather than serving one customer’s state to another.
If the page starts quickly but looks blank, find the LCP element
LCP may be a hero image, a large heading, or another visible element. Google’s LCP breakdown separates the wait into TTFB, resource-load delay, download time, and render delay. Check which part is actually long. Reducing an image by 100 KB will not help much if the browser waits a second before it discovers that image, or if a font and stylesheet postpone the text.
When the LCP is an image, serve an appropriate size for the screen, use a modern format where it genuinely reduces bytes, and check that the browser chooses a responsive source. Do not lazy-load an image visible in the first viewport; Google lazy-loading guidance explicitly warns against that. Reserve lazy loading for offscreen images. For a text LCP, look at the critical CSS and font-loading path before re-exporting every photograph on the site.
Page weight is still worth measuring, but there is no universal 250 KB “ideal page” and no single 3-second load-time rule that fits every page, device, or connection. Look at the largest requests in the waterfall and ask whether they are necessary above the fold. A heavy video or a collection of decorative images may deserve attention. A small HTML document can still lead to a slow experience if it starts a long chain of fonts, CSS, and JavaScript.
If taps feel delayed, look at JavaScript and third parties
A page can appear complete and still respond slowly to a menu, filter, form, or add-to-cart button. INP measures the delay around real interactions. In a lab, reproduce the exact slow tap with the browser Performance panel. Check whether long JavaScript tasks, expensive event handlers, or layout work occupy the main thread.
Chat widgets, analytics tags, video embeds, and page-builder features can add network and processing work. The number of files alone does not tell you which one hurts. Google’s third-party script guidance recommends auditing what a script does and how it loads. Remove an unused integration first. Delay a nonessential script only after checking its dependencies and the behavior of forms, menus, consent tools, and checkout. Blanket “defer every script” settings can turn a speed fix into a functional bug.
If the page jumps, fix the space before the content loads
A layout shift is often visible without a tool: the button moves just as someone tries to tap it, or the text drops when an image arrives. Google CLS guidance recommends reserving dimensions for images and video. Also inspect late banners, embeds, and font changes. Compressing an image can reduce transfer time, but it does not by itself reserve space for that image.
Plugins and the database: measure the work, not the count
My old version of this article said a site should have no more than 10 to 15 plugins. That was a bad rule, and I have removed it. One plugin can run an expensive query or load a large script on every page; several small plugins may have little effect. What matters is the work they do on the pages that are slow.
Make a staging copy, then test a suspected plugin or feature one change at a time. Use a profiler or server logs to see which PHP functions, database queries, and external calls take time. WordPress’s performance guidance recommends measuring and selectively disabling plugins to identify an actual bottleneck. Do not turn off live payment, security, or form integrations merely to make a score look better.
The database deserves the same restraint. A slow query, oversized autoloaded options, or repeated external calls can matter. Deleting revisions and comments without evidence may do almost nothing for the slow page. Back up first, find the expensive operation, and choose a fix that addresses it. A database-cleanup plugin is not a substitute for profiling.
A practical way to work through one slow page
- Choose one representative URL and write down exactly what feels slow: first response, main content, a specific interaction, or shifting layout. Test the same state each time, especially logged-in versus logged-out.
- Check PageSpeed Insights for that URL on mobile and desktop. Read field data when available, then use the lab report to locate the element or request involved. Record the date and whether the report is URL-level or origin-level.
- Inspect the network waterfall and, if interaction is the problem, reproduce it in a browser performance trace. Note the response delay, largest resources, LCP element, and any third-party work. Do not diagnose from a score alone.
- Make one change on staging. For example, resize the actual LCP image, remove an unused embed, or correct a cache rule. Keep a record of what changed so you can roll it back.
- Run the same test again under comparable conditions, then check the real page: menu, form, checkout, mobile layout, and logged-in view as applicable. Repeat measurements because one lab run varies. Watch field data over the following weeks rather than expecting an immediate 28-day trend change.
If the delay began with a 503 error or a resource spike, the WordPress 503 guide gives a more specific diagnosis path. If the problem is a chain or loop between domain variants, use the WWW redirect guide. Do not delete legitimate redirects simply to shave off a request; fix the unnecessary hops while preserving the correct destination.
When optimization is no longer the whole answer
Sometimes a site is slow because every page is carrying a design and feature stack that no longer matches the business. You can improve an image or cache rule and still leave visitors with a confusing path to the offer. That is a different decision from performance tuning. I wrote about the distinction in my look at the MansoorX rebuild. A rebuild should be justified by the business and content problems as well as the technical ones.
Start with one slow URL and one observed bottleneck. If you want a second pair of eyes on a business site, send me the link for a three-point website review. I will look at clarity, trust, and the next step a visitor is asked to take. A performance investigation may require deeper access and separate testing.
Measurement note: the MansoorX HTTP sample above was collected on 27 September 2026 with five direct, compressed requests from one network location. It is a small diagnostic example, not a real-user speed study, a full browser test, or proof of a particular server-side cause. Product and metric guidance was checked against Google, WordPress, and WooCommerce documentation.